ISSN: 2056-3736 (Online Version) | 2056-3728 (Print Version)


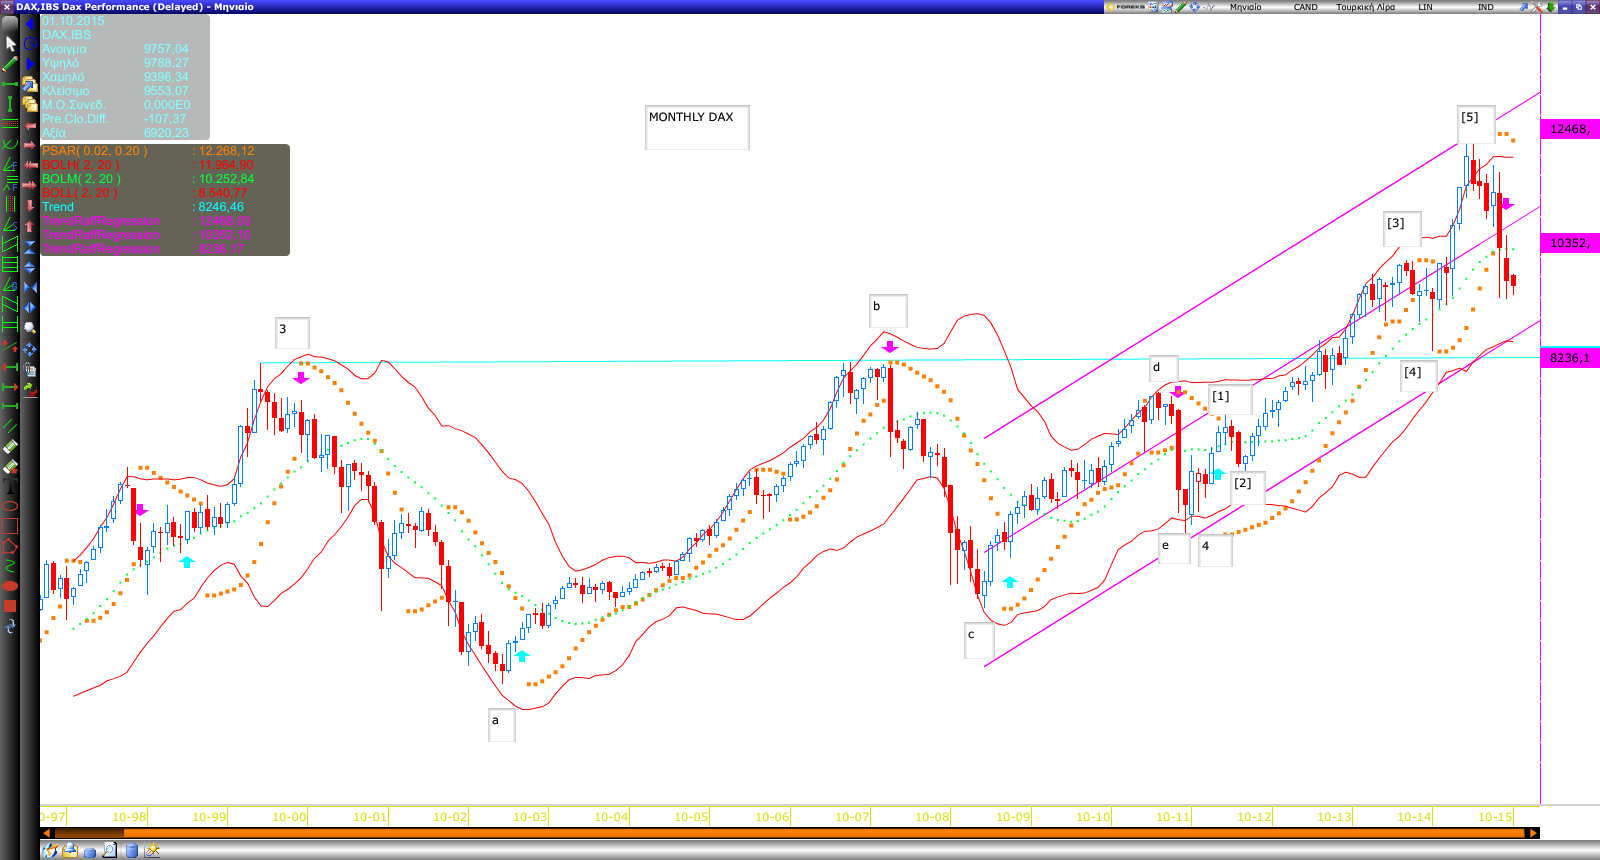
On the monthly DAX chart shown below, the swings between 2000 and 2011 count well as an Elliott wave triangle. The subsequent rally then displayed the clear five-wave structure we would expect of an impulsive terminal wave that should follow a triangle.
By Theodoros Batsoulis
Technical Analyst
Risk Market
www.riskmarket.co.uk