ISSN: 2056-3736 (Online Version) | 2056-3728 (Print Version)


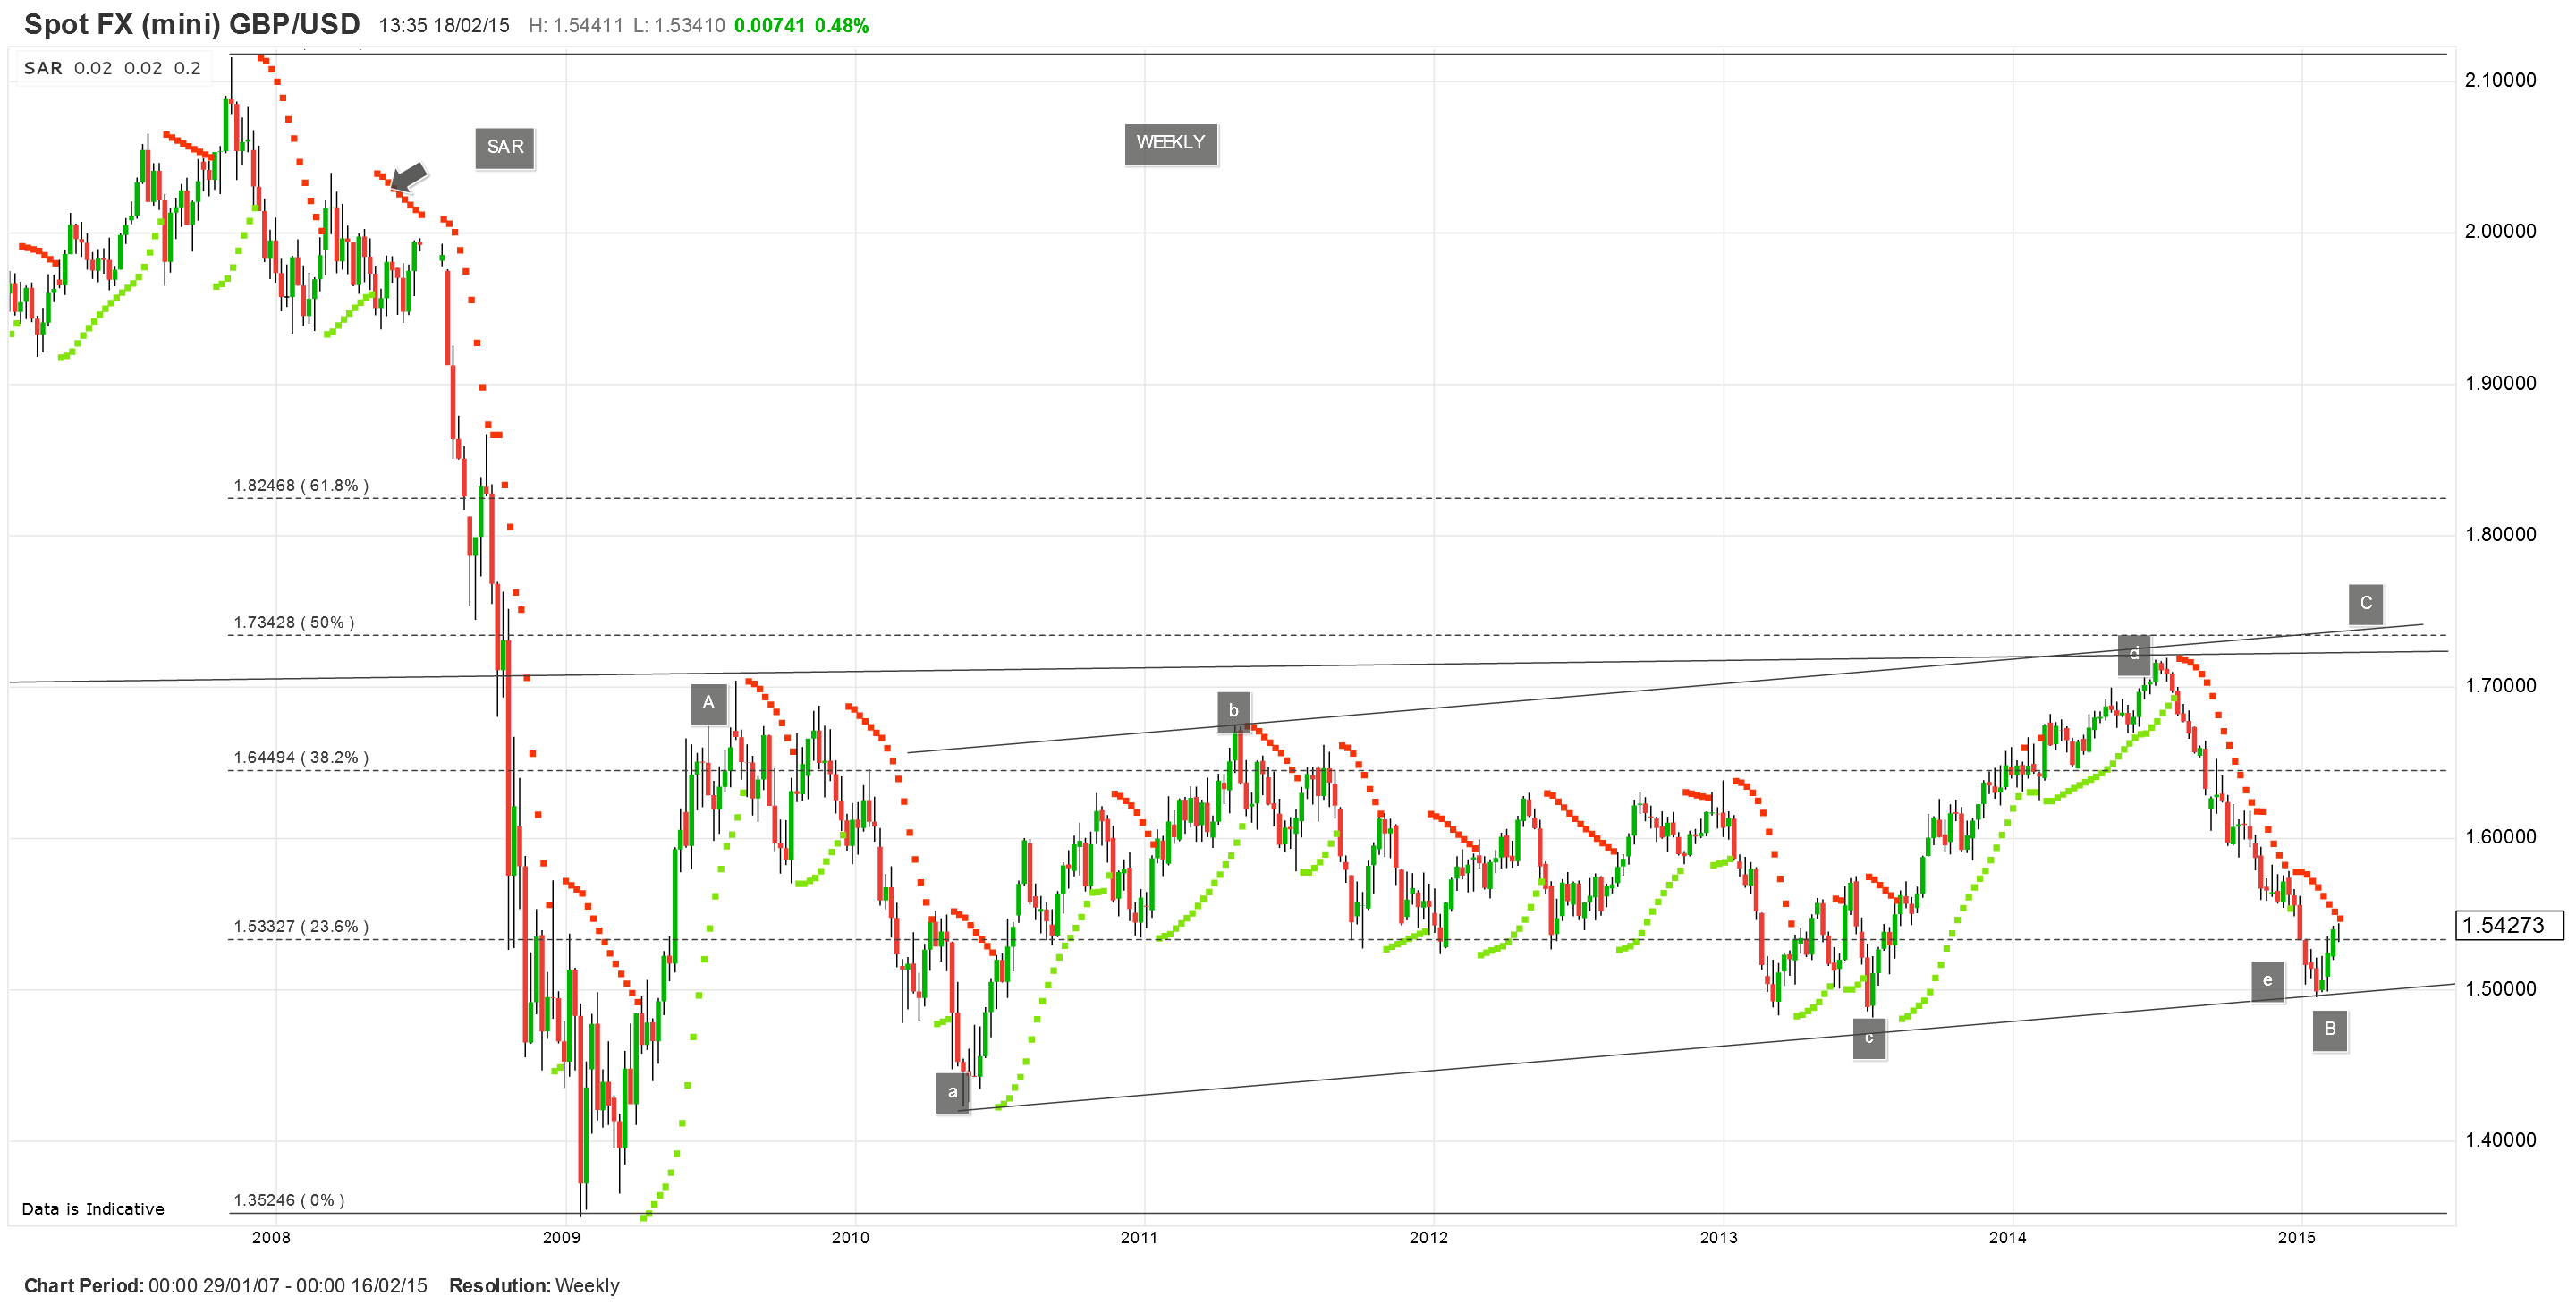
In the long-term weekly chart is well recognize that the downward movement since $1.72 is merely part of a multiyear volatile sideways movement in the form of wave B. Wave B is composed of five waves a to e, where e is now very likely ended with the depth at $ 1.4950 with. The running there support line , which has its origin in early 2010 , was at least so far obviously well defended . Here should be so start a recovery that could then over the next few months to achieve the brand from 1.72 to 1.74 $ [wave C] in the best case , however , where then block again hammer hard resistors the way up .
By Theodoros Batsoulis
Technical Analyst
Risk Market
www.riskmarket.co.uk