ISSN: 2056-3736 (Online Version) | 2056-3728 (Print Version)


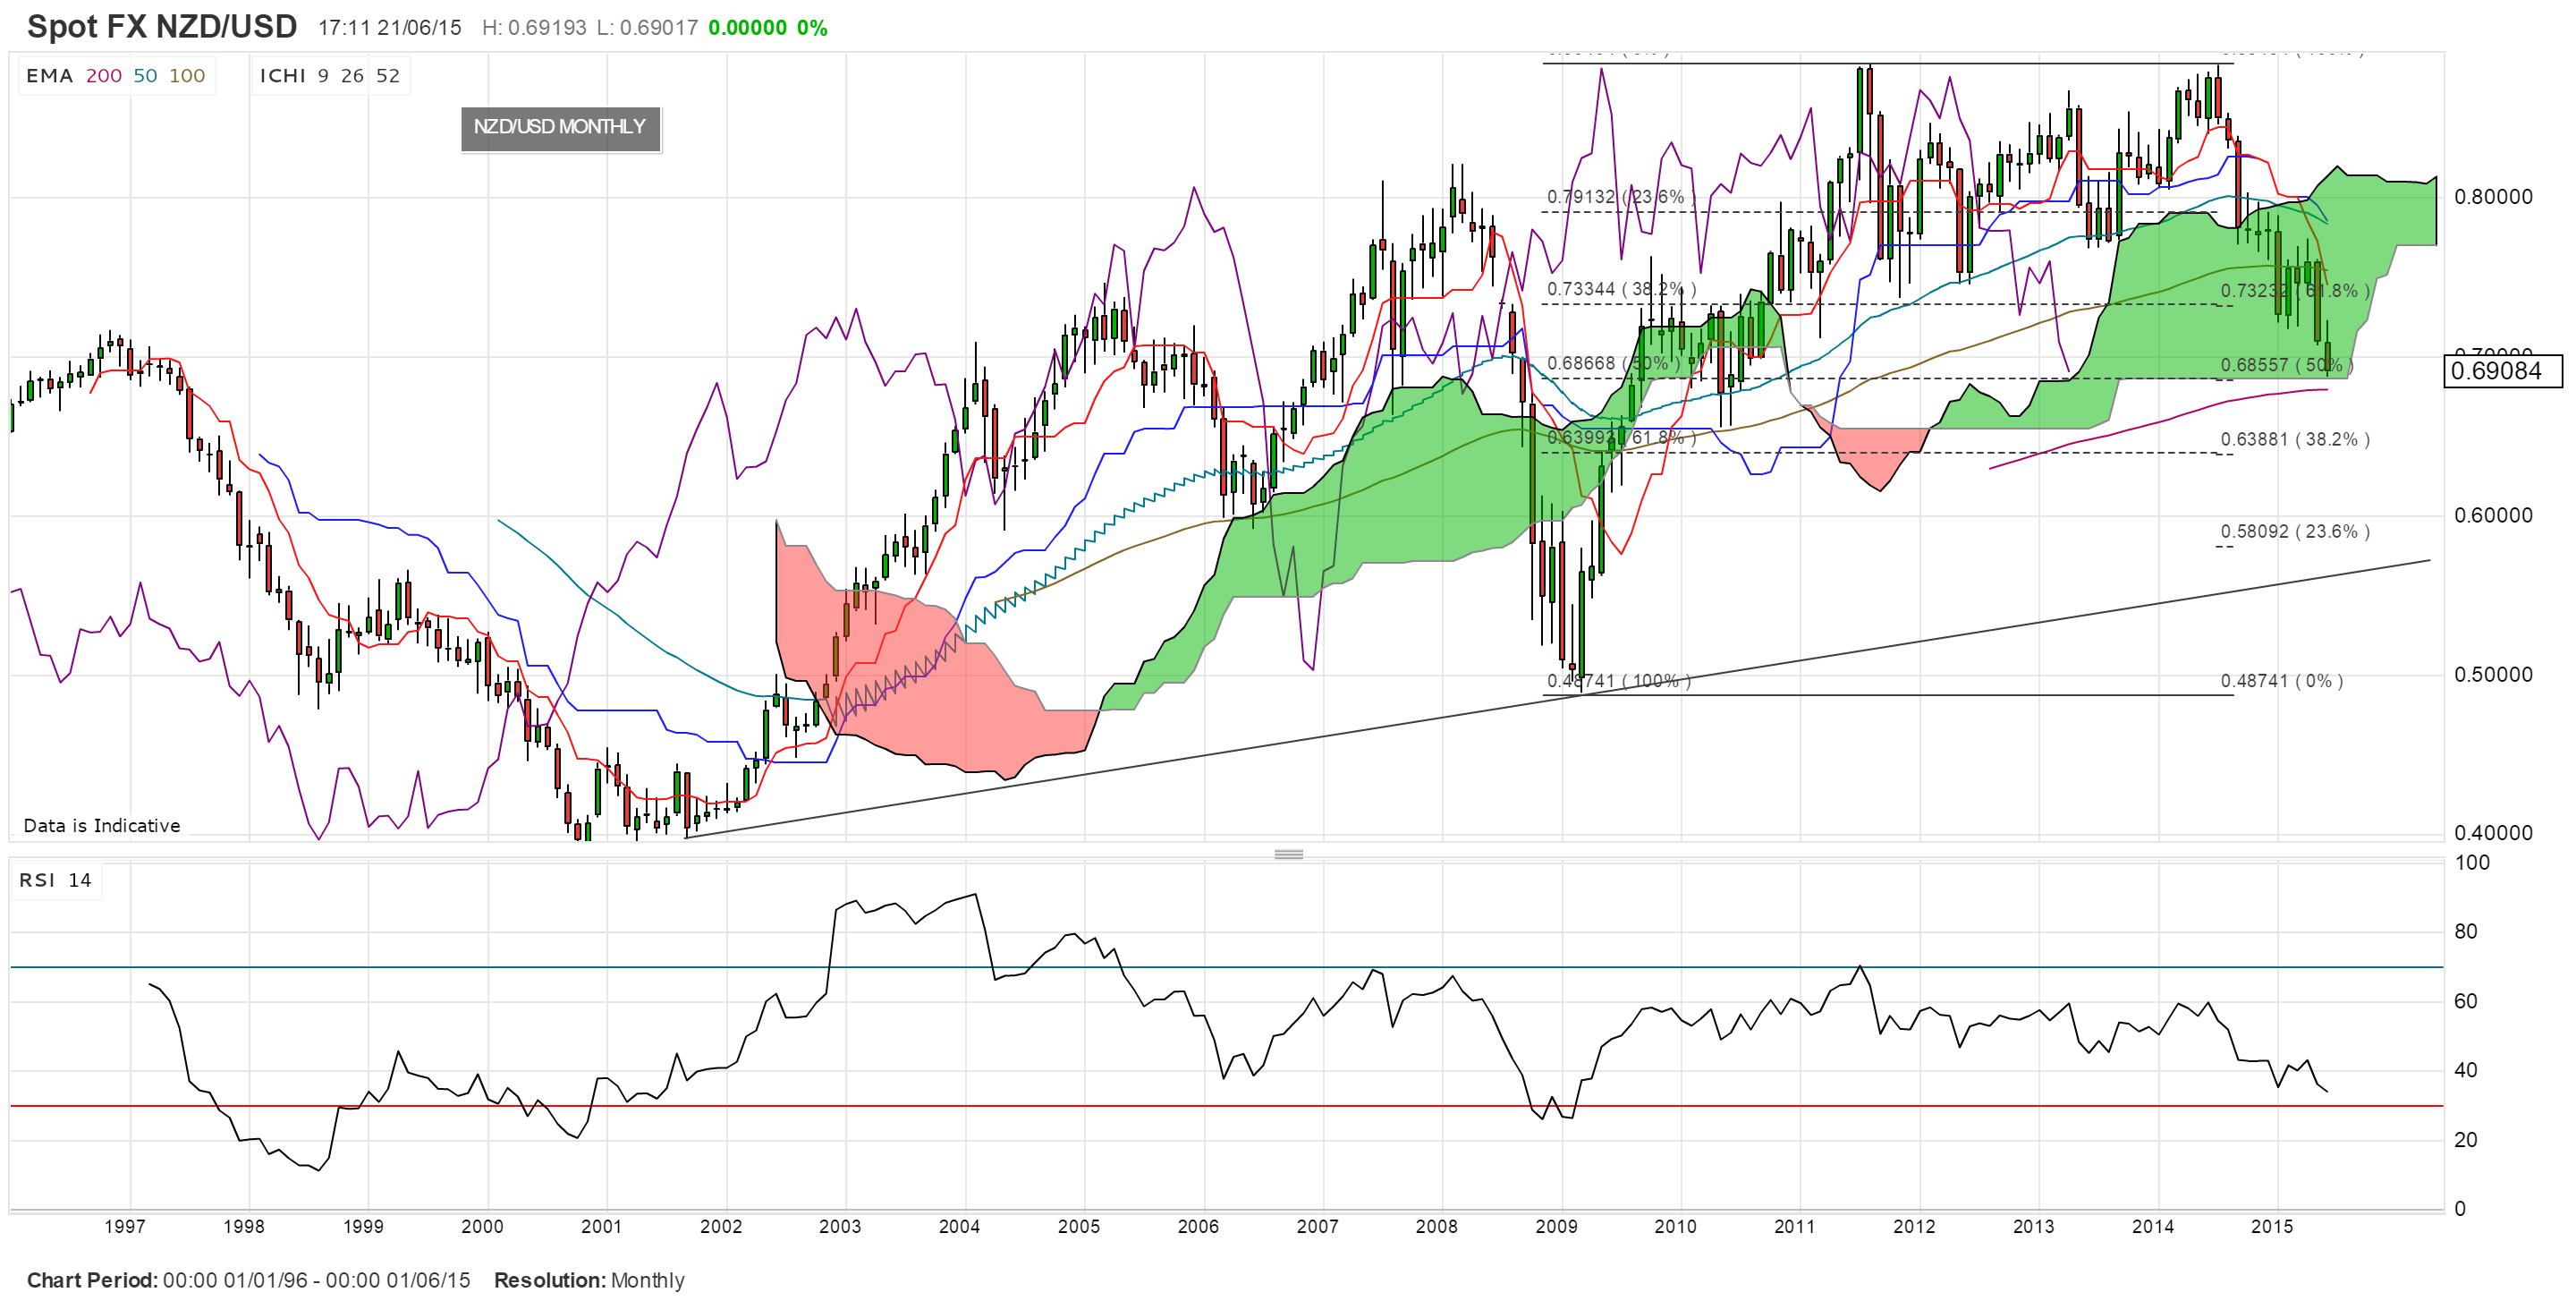
‘Double Top’ breakdown on Monthly chart? The monthly chart still reveals a possible ‘Double Top’ pattern with a neck line at 0.735. The monthly candle close below this level for January suggested a possible 2,000 pip bearish follow through move as this is the height of the ‘Double Top’. The May monthly candle closed below this level so this may mark the start of the bearish breakdown here. Technical theory would suggest looking for a test of 0.735 before bearish continuation. Price is still trading below the Ichimoku Cloud on the 4hr, daily and weekly charts and in the lower part of the Cloud on the monthly chart. A break and hold below the monthly Cloud would be bearish but this region may offer some support to the NZD/USD.
By Theodoros Batsoulis
Technical Analyst
Risk Market
www.riskmarket.co.uk