ISSN: 2056-3736 (Online Version) | 2056-3728 (Print Version)


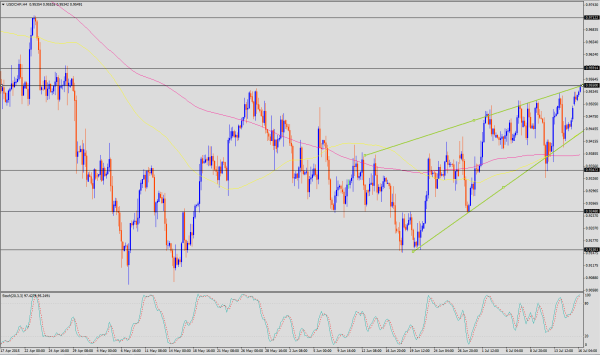
The pair has been steadily rising since the middle of last month. You can see a rising wedge pattern forming on the 4-hour chart. The price is in the bullish moods and is currently trading above the wedge’s strong resistance at around 0.9550 (July 16th and May 27th high), and might not be in the mood to continue higher. Just in case it does, the next resistance is located at 0.9591 (April 28th high), followed by 0.9712 (April 23rd high).
The Stochastic indicator is telling us that another possible scenario might be in play. You see, it is in the overbought region, and from what we’ve seen from the past performance, the price does not tend to stay there a long time before it sinks down.
The 200SMA (pink) is below the 100SMA (yellow), which also hints on the fact that you should get ready for a downtrend.
Should the downtrend appear, the price could go down to 0.9347 zone (July 10th low), followed by 0.9248 (June 29th low), below which it could extend to 0.9156 (June 18th and June 19th low)