ISSN: 2056-3736 (Online Version) | 2056-3728 (Print Version)


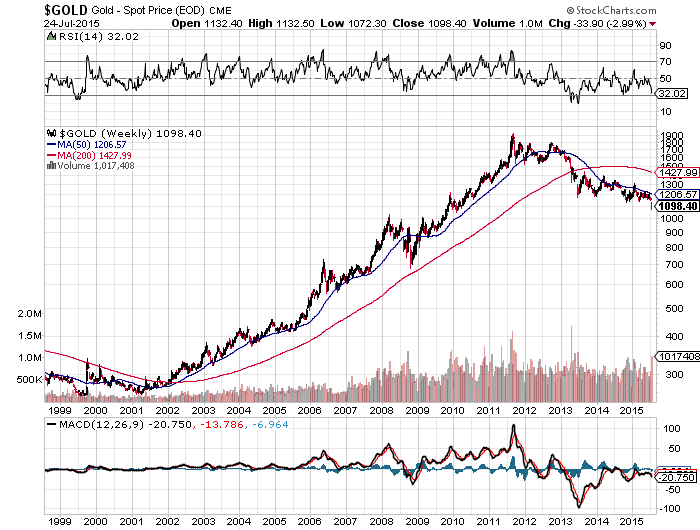
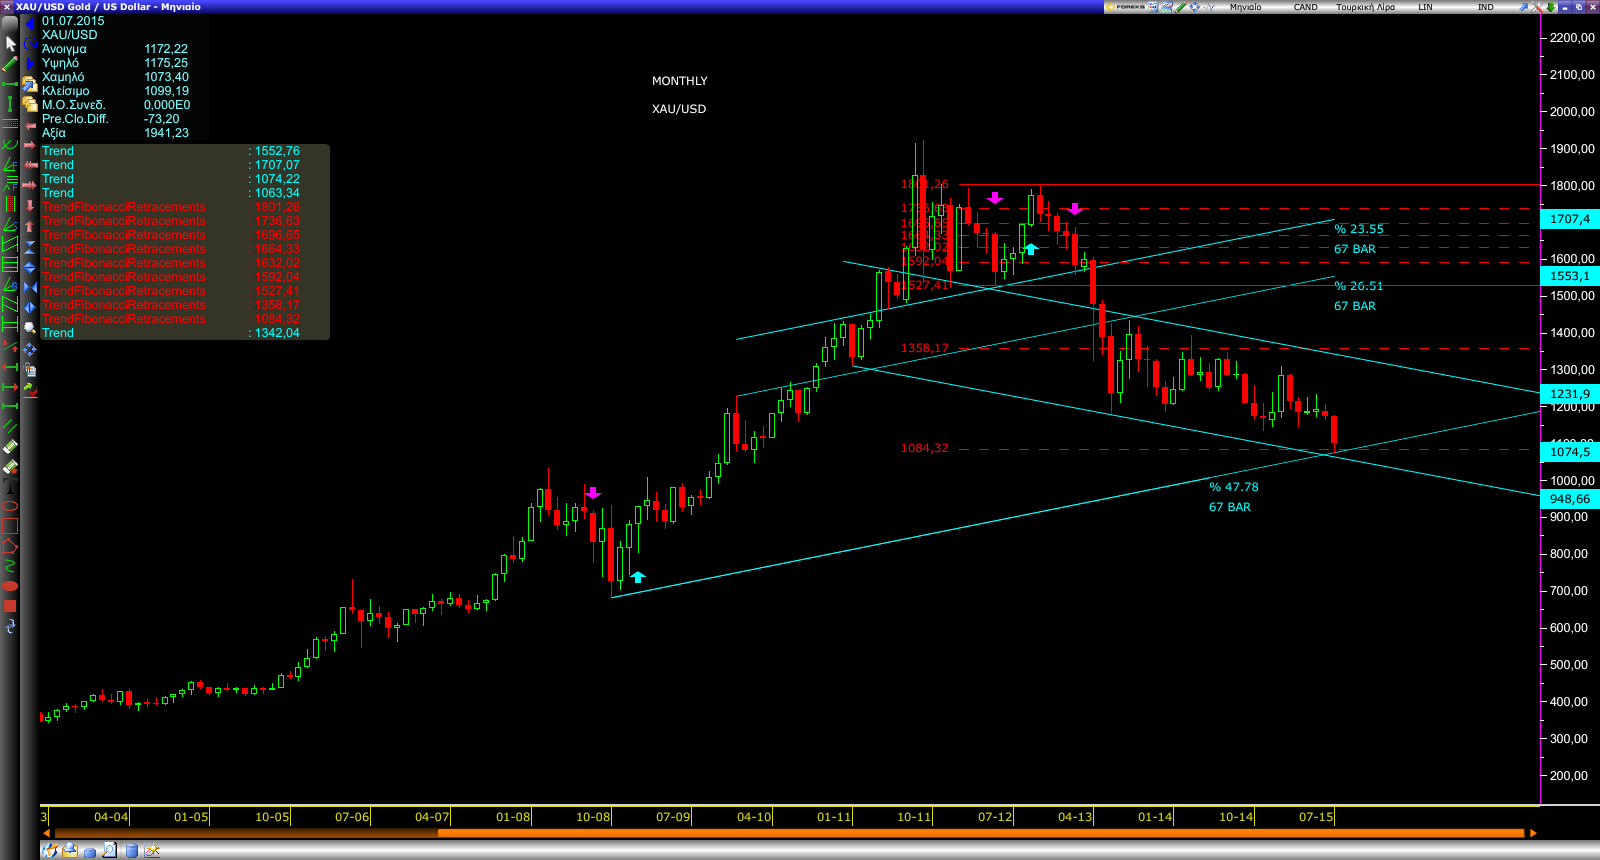
The very long term monthly chart for gold shows the massive H&S top that actually started to build out in 2010 and broke below the neckline just over a year ago and has been in backtest mode until recently. You can see the price action is now starting to fall away from the neckline now beginning its impulse move down shaded support and resistance zone.
By Theodoros Batsoulis
Technical Analyst
Risk Market
www.riskmarket.co.uk